Sustainability at Món Sant Benet
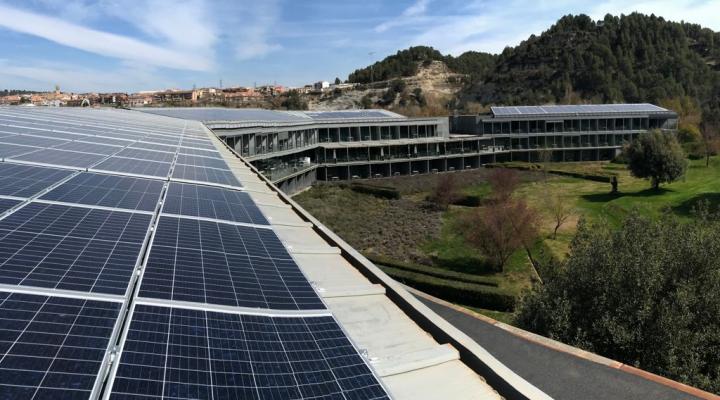
As part of our commitment to our environment and its biodiversity, Món Sant Benet has installed a photovoltaic panel system to generate electricity on the roof of the Hotel and the La Fàbrica building. This measure implies an annual saving of 158 Tons of CO2 and responds to Fundació Catalunya La Pedrera's commitment to turning Món Sant Benet into a self-sustaining space.
Real-time data on photovoltaic panels installed on Hotel Món